HP 50g Calculator - Calculating Single Variable Standard Deviation using the Pre-programmed Features
Introduction
Standard deviation is a statistic that measures the
variability or dispersion of a set of data. It is calculated from the
deviations (distances) between each data value and the sample mean, and
is often represented by the letter ‘s’. The more disperse the data is,
the larger the standard deviation. The standard deviation squared is
called the variance.
Calculating single-variable statistics
One method for calculating single variable, standard
deviation involves launching one of the pre-programmed statistical
applications by pressing
 . Highlight the desired option and press
 to select it. Press
 to enter data into the columns of the ∑DAT matrix. The procedure is as follows:
-
Press.
-
Select ‘Single-Var..’ by pressing(the F6 key). An input form labeled ‘SINGLE-VARIABLE STATISTICS’ is displayed.
-
Press thesoft menu key (the 'F1' key).
-
Enter the data in column 1. On the last entry, presstwice to reopen the SINGLE VARIABLE INPUT form.

-
Pressto highlight the ‘Type’ field and press the
 soft menu key. The options for sample or population statistics are displayed in the choose menu.
-
‘Sample’ is a set of numbers, usually taken from a much larger population.
-
‘Population’ is a set of all numbers, which is the whole population.
-
-
Select ‘Sample’ or ‘Population’, then press thesoft menu key.
-
Pressto the ‘Std Dev’ field, then press thesoft menu key.

-
Press thesoft menu key. The result is displayed on the stack.
Example for calculating single-variable statistics
Below is an example for entering a set of data and
finding the single-variable statistics results. The example is
calculated in RPN mode, however, it may be calculated in either RPN or
Algebraic mode.
-
Press.
-
Select ‘Single-Var..’. An input form labeled ‘SINGLE-VARIABLE STATISTICS’ is displayed.
-
Press thesoft menu key.
-
Enter the data below in column 1. In this example, the row numbers appear before each entry to verify the entries. Use the arrow keys to highlight the next field in Column 1 prior to entry, if necessary :Figure : Entering the data
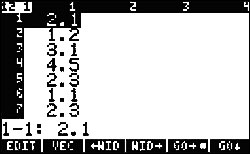 Using this method for data entry, the data in Column 1 displays as shown in the above figure.
-
2.1, press.
-
1.2, press.
-
3.1, press.
-
4.5, press.
-
2.3, press.
-
1.1, press.
-
2.3, press.
-
1.5, press.
-
1.6, press.
-
2.2, press.
-
1.2, press.
-
2.5, presstwice.
-
-
Pressto the ‘Type’ field and press thesoft menu key. The option of sample or population statistics will be displayed in the choose menu.
-
Select ‘Sample’ and then press thesoft menu key.
-
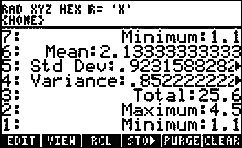
Use the arrow keys to highlight the various fields and thesoft menu key to select:
-
Mean
-
Std Dev
-
Variance
-
Total
-
Maximum
-
Minimum
-
-
Press thesoft menu key. Press the up arrow key to view the results displayed below:Figure : Results for Sample statistics
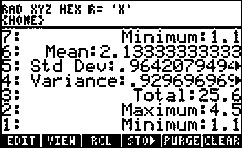 Similarly, to calculate the results for Population statistics for the same data, at this point, press. Select ‘Single-Var..’ and press. Highlight the ‘Type’ field using the cursor keys and press. Highlight ‘Population' and press. Repeat steps 7 and 8 above. The results are shown below.Figure : Results for Population statistics